Last updated at Wed, 25 Oct 2017 17:23:11 GMT
I’ve recently been playing with a number of PAAS platforms, and its bringing me back somewhat to my days toying with J2EE application servers, JDBC drivers, Relational DBs etc. Oh how I remember deploying servers and databases and then checking out my shiny new application, remember the J2EE petstore anyone?? 🙂
However the big difference with PAAS, over old school application servers is that you do not need to spend a few days configuring them and figuring out the subtle differences between how you deploy on different vendor platforms – ever try switching from JBoss to Websphere in less than a week 🙁
PAAS is taking the P(ain in the)ASS out of configuring and managing your middleware and is pretty much one click (ok maybe a few clicks) configuration. One noticeable difference between PAAS vendors however, is the access given to the underlying middleware and server your code runs on. This ranges from almost full access (e.g. Engine Yard) to more restricted or no access (e.g. Heroku, Google App Engine).
Naturally there are pros and cons in both cases. The big positive of zero access to the server instance is the ‘you do not need to know’ argument i.e. no system administration skills required. Simply let the PAAS provider worry about managing your instances and you worry about writing your apps (what is being referred to by some as NoOps these days).
However if on the other had you would like to have more control and you prefer to flex your sysadmin skills from time to time, then you may prefer the Engine Yard approach. With Engine Yard you get full ssh access to your instance, and get a normal server environment for when you need to install packages from the repositories etc. Note, Engine Yard also provides a nice UI interface so you don’t have to deal with the command line unless you really want to.
From a logging perspective Engine Yard is pretty good as you get full access to your /var/log/ folder which stores almost all of the important server logs you may want to look at. More details on Engine Yard logging to follow further down…
In comparison, the likes of Heroku and App Engine have limited access when it comes to logging i.e. with the standard Heroku logging you get access to only the last 500 events, which is not great if you need to go and look at an issue that a customer reported over night for example. However, Heroku have more recently introduced a number of logging addons you can select from. And Heroku’s logging infrastructure, Logplex, allows for seamless, one click integration with the add on providers, which means you get Log Management configured out of the box in a single click. If you use Logentries you get unlimited log storage and preconfigured error highlighting/alerts for Heroku, which means you can easily go and find that issue, whether it happened last night, last week or last month.
App Engine also has a limited logging buffer. However the App Engine roadmap currently lists “Logging system improvements to remove limits on size and storage” as being currently on the agenda, so it looks like these restrictions will be lifted pretty soon also. In the mean time you may want to use this.

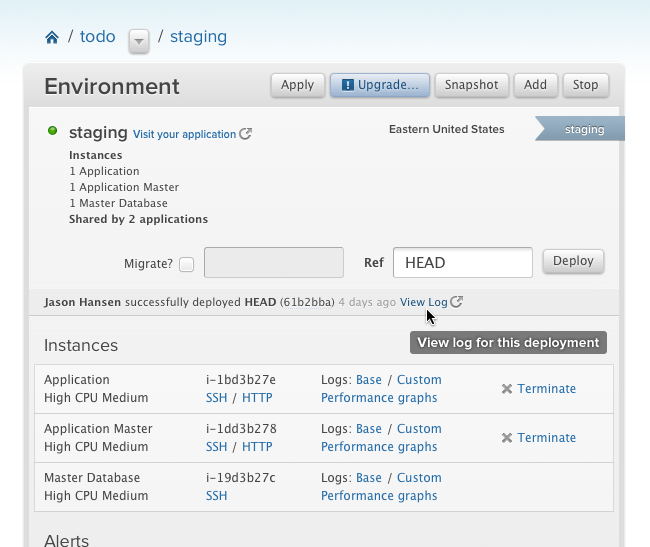
Engine Yard uses the linux gentoo distribution, so most of the important logs are stored in the /var/log folder. We’ll explore this in a moment. However, one of the first logs you may end up looking for is the yourapp-deploy.log, which lives in your home folder. This records deployment related log events so it’s where you’ll look if you had deployment issues. It is also available through the Engine Yard dashboard where it can be easily accessed. There are a couple of other logs available in the dashboard view also, namely, the chef logs containing information on the base chef script run by default when you launch an Engine Yard instance(base log) and log events generated from any custom chef scripts you have configured to run (custom log).
Shawn Hong’s post gives some nice insight into how to begin debugging when your Engine Yard hosted site/application goes down, beginning with checking your deploy and chef logs. However, if this doesn’t solve the issue, he suggests you need to dive deeper than the Engine Yard dashboard and ssh into your instance.

There are a bunch of useful log files available when you do this. These logs may be useful if you are suffering some downtime and are running through the recommended Engine Yard diagnostic checklist. You can access these from your /var/log folder as mentioned above. I’ve listed a number of these below (in no particular order) and give some insight as to why they may be of interest:
production.log: The production log is useful if you need to look at what is going on at the rails level. Its located at /var/log/engineyard/apps/yourapp/production.log. If you need to debug your app or figure out where there are performance issues this may be the place to look. There are also tools for ‘squeezing some useful info’ out of the production log, such as the logjuicer or the Rails Analyser Project. You can also check out some of these railscasts that show how to use these tools to analyse your produciton.log to identify bottlenecks in your app, i.e. figure out which controller actions are consuming most execution time – usually the best candidates for optimization. Some useful, more general, rails logging tips can be found on Mike Naberezny’s blog
nginx logs: Your nginx logs are located at /var/log/nginx/. Nginx log events are stored in the yourapp.access.log and yourapp.error.log. The access log contains records of requests made to the web server, with any related errors being sent to the error.log. Further info on nginx logs can be found at nginx.org. Also Martin Fjordvald has a nice post on tuning nginx for high loads, albeit in a php context. However he covers both the access and error log and makes some points relevant for any Nginx users.
mysql logs: Database logs can be useful for investigating slow queries or DB related errors. Note, there are a number of different storage locations for mysql logs on Engine Yard depending on the server version and product. On the Managed platform the logs can be found under /db/mysql/log/ which is also the location for logs on the Engine Yard Cloud for MySQL 5.0. For Cloud MySQL versions 5.1 and 5.5 the logs can be found under /db/mysql/{major_version}/log/ (/db/mysql/5.5/log). When in doubt this information can always be found in any environment at the *nix command line by running the command mysqld –help –verbose|grep ‘^log-slow-queries’ (thanks to @tylerpoland for helping us figure this out). Once you navigate to the relevant location you will find the mysql server logs which include, the error log, general query and slow query logs. The guys at Engine Yard suggest the slow query log is one of the best places to look if your having ROR performance issues and need to optimize.
Mongrel or Passenger logs: If you have mongrel logs, they are sent to /var/log/engineyard/mongrel/myapp/. Passenger logs are available from /var/log/nginx/passenger.log.
Plain old linux logs: The /var/log/ folder also contains all the usual linux log files that you love to know. Typically the main syslog file is one that you will want to analyse from time to time. For example, if you’re using Monit and Mongrel and your application is gobbling memory and feeling a little bloated, i.e. using more memory than you should be, you’ll want to check the main syslog file. Monit logs to syslog and can tell you when you’ve hit your memory limits.
Aug 29 03:35:05 myserver monit[5194]: 'mongrel_myapp_5000' total mem amount of 133256kB matches resource limit [total mem amount>130360kB]
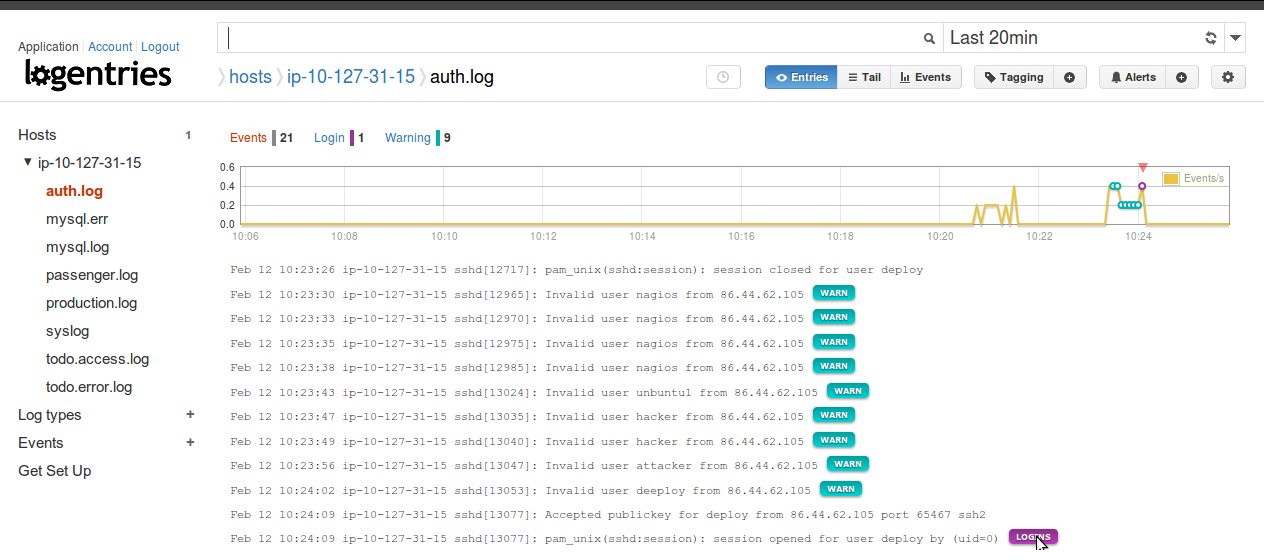
However, the main syslog file tends to capture a lot of events from different sources (it depends on your syslog configuration, located at /etc/syslog.conf, which specifies what events to send to your different syslog files) and in some cases you may want to dip into one of the more specific files if you know, exactly what you are interested in. For example the auth.log file captures any ssh access or attempted ssh access to your instance. It’s a good idea to regularly review this file and maybe even set alerts around successful log ins, so that you know when someone logs into your box. The screen shot below shows an example of what a successful dictionary attack on a server instance would look like. You can see in my Logentries account (below) I have tagged both the unsuccessful and successful login attempts to highlight these. If you are running some cloud instances, you’ll find your instances are hit almost daily with dictionary attacks. If you have restricted your instance to ssh key access only, you are generally ok, and these will fail. However servers with username/password remote access are susceptible to attacks. Any server with username password access with some default login (e.g. nagios defaults or simplistic username/password combination) will have a good chance of getting compromised. If on Engine Yard or AWS EC2, you can only use ssh key access so you’re more than likely going to be ok. Nonetheless I always feel its a good idea to keep an eye on this log file and alert on logins, even for peace of mind.
 Finally, if you need to analyse your logs and like hanging round on the command line you should check out some useful grep tips from thegeekstuff. These are useful for searching and filtering noise when you have lots of log events.
Alternatively if you’d rather not have to ssh onto each instance when you think there is an issue check out our guide for configuring Logentries with Engine Yard. Note, we provide some chef scripts for this so you can automate configuration for every instance you launch.
Agree/disagree/left out anything you think is important… please SHOUT below…
