A few months back Heroku introduced log-runtime-metrics, which you can enable from the command line to insert CPU load and memory usage metrics into your log events at 20 second intervals.
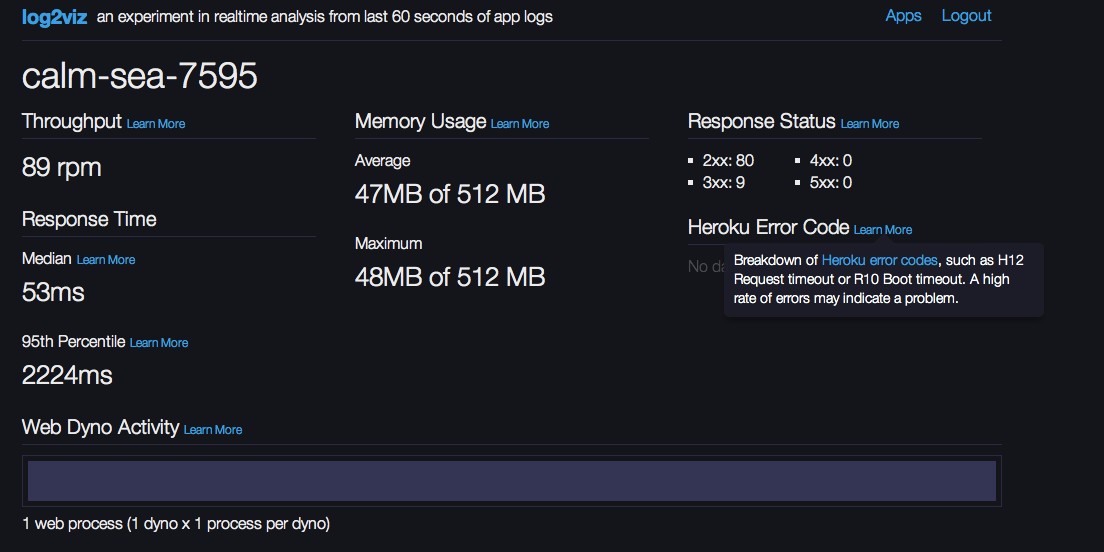
Like all log data in its raw format it’s not massively useful to see metrics getting dumped into your logs every 20 seconds. That’s not exactly what Heroku had in mind, however. At the same time they introduced log-runtime-metrics, Heroku also released their open source log2viz experiment which gives you real time analytics extracted from your logs. Log2Viz gives you a view into what is happening in your app from a performance perspective over the last 60 seconds. For example I can get a view into my app response time and memory usage, as well as any nasty Heroku system errors that may have occurred. I have to admit, that’s pretty neat, and Log2Viz is a great tool to for showcasing the power of combining real-time analytics and logs that contain useful data.
Log-runtime-metrics
Heroku’s log-runtime-metrics inserts per-dyno stats on memory use, swap use, and load average into the app’s log stream. CPU load averages are reported at intervals of the last 1 min., last 5 min. and last 15min (similar to running top or uptime on your linux/osx box), while the memory and swap stats give a view into how much RAM, cache and disk are being used.
Tracking spikes over time
While a load average of 1.0 might be fine for your app a load average of 10.0, for example, might spell trouble for system performance and, if prolonged, may lead to degraded response times. Logentries’ field level extraction allows you to easily tag and track spikes in your performance metrics. Using field level extraction you can work with field values when searching, using tags or setting alerts. For example tracking when load average spikes to 10 or over can be achieved with the following search query.
Log Event: 2013-10-14 00:13:58.557715+00:00 heroku web.1 – – source=web.1 dyno=heroku.906 sample#load_avg_1m=10.01 sample#load_avg_5m=10.03 sample#load_avg_15m=10.02
Search Query: load_avg_5m>10
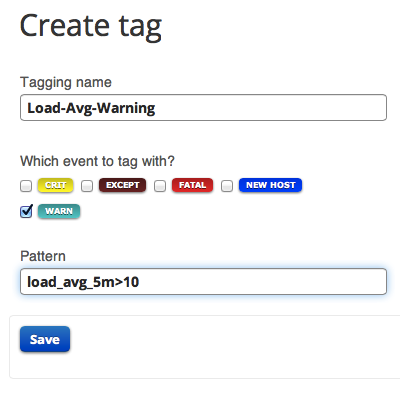
Creating a tag with the search query defined above will allow you to identify, within your logs, when this threshold has been breached.
Then create a graph to visualize where load avg spikes above 10.0 over time:
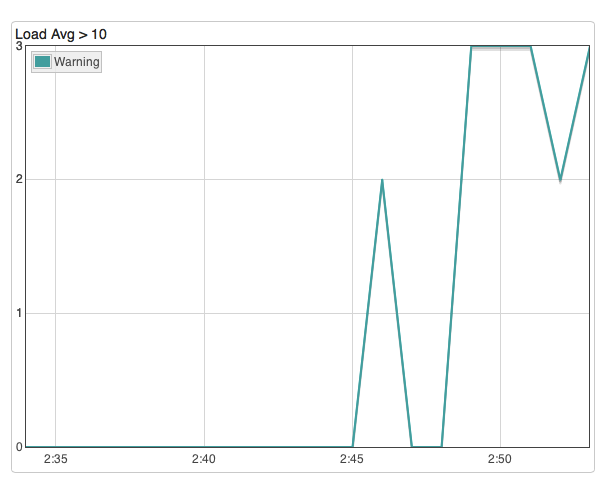
You can easily do the same for any of Heroku’s log-runtime-metrics, e.g. track peaks in memory, disk or swap usage.
Correlating with Response time
Ultimately you will probably care most about what your users experience in terms of response time. There are certain response time limits that users may deem acceptable before they walk away.
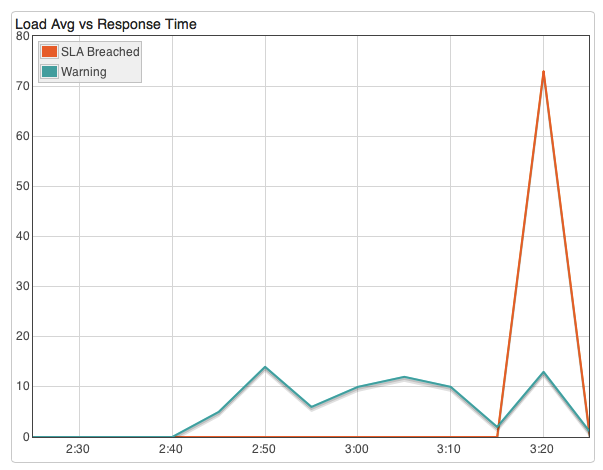
Tracking spikes in response time alongside peaks in load average, for example, can help you understand if and when it makes sense to kick off an extra dyno or two.
To do so you can create a tag in the same way as above. For example, the tag created below identifies any app request from my Heroku app that took longer than 300ms.
Log Event: 2013-10-15 02:46:50.264118+00:00 heroku router – – at=info method=GET path=/ host=calm-sea-7595.herokuapp.com fwd=”x.x.x.x.hsd1.ma.comcast.net” dyno=web.1 connect=3ms service=375ms status=200 bytes=4174
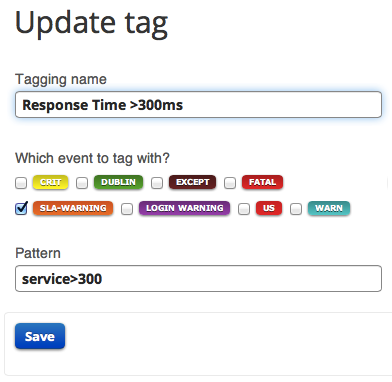
Next add this to your graph to track peaks in response time vs peaks in load average…
Get notified when response time breaches what you deem as acceptable
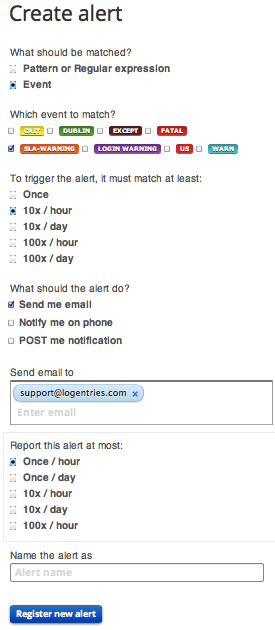
As a last step you might want to get a notification when response time breaches what you deem as acceptable. You could read a 70 page user manual on setting up alerts, however you might prefer to set up an alert in 4 simple steps instead:
(1) select the event you want to get alerted on (e.g. any request that takes more than 300ms)
(2) determine how often this needs to happen before you want to know about it – e.g. is once enough – or does this need to happen multiple times before you start to get concerned?
(3) how would you like this alert to be delivered? Via email or straight to your mobile device, for example.
(4) and, finally, so your mailbox does not get flooded, you’d rather only get one email every hour on this…
