We recently announced our add-on program at Logentries, which allows third party vendors to send their log data to Logentries< and to highlight important events for their users via our tagging, alerting and reporting features. This allows vendors to predefine what log events their users really need to know about and if there are particular thresholds that indicate trouble may be looming. Users get the benefit of having the vendor’s expertise built into Logentries so that they can better understand any vendor specific errors that appear in their logs, such that they can better react to any issues – a win-win if you will.
Heroku makes Logging even Better
The fist 3 vendor add-ons that have integrated with Logentries (Heroku PostGres, Adept Scale & CloudAMQP) are all part of the Heroku add-on ecosystem. This is in part thanks to Heroku’s newest logging capabilities which now allow any Heroku add-on vendor to route their log data into Logplex for forwarding. Logplex is Heroku’s logging infrastructure which had already captured any log events emitted from your Heroku application as well as any events produced by the Heroku platform itself. Now, however, it can also capture log events from any of your add-ons so that you have visibility across your application, the Heroku platform AND any third party add-ons you are using. On top of this Heroku announced their log run-time-metrics earlier this year, which you can turn on for any of your apps. Turning this on enhances your log events with additional performance characteristics so you can truly begin to use your logs as data, and opens up the ability to do better performance monitoring and troubleshooting via your logs.
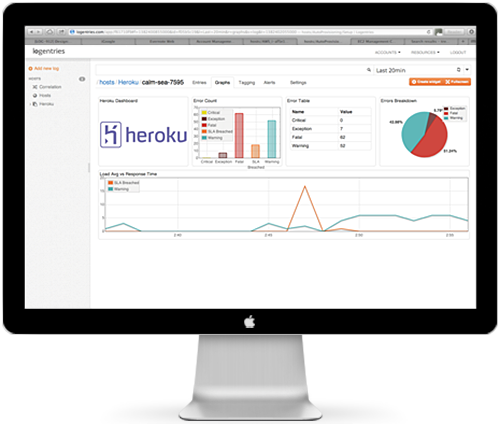
The Logentries Heroku Dashboard
In light of these new additions, we have enhanced our out-of-the-box experience for Heroku users. Along with pre-defined tags and alerts for anyone using Logentries via Heroku, we have also added a new dashboard that gives a higher level view of any important Heroku log events, without having to dig into your log events themselves.

We also highlight any requests that have taken over 150 ms and correlate these with your Heroku error codes so you can easily see if there are any error patterns that relate to reduced performance for your end users. Note you can easily modify the ‘150ms’ threshold that we have set to whatever value you feel is appropriate for your app.
Logentries Add-ons
Our add-on partners have essentially created a similar out of the box experience for their users via the Logentries Add-on API, i.e. important log events are automatically highlighted (via tags), alerts are auto-created for important events, and a dashboard is available for a higher level view of what is happening.
Diving into the Cloud AMPQ add-on
Our first 3 partner add-ons are thanks to Heroku PostGres, Adept Scale and CloudAMQP. All of these services also conveniently route their log data into logplex via the Heroku provider log integration API.

CloudAMQP provides RabbitMQ as a service and is a popular message queuing add-on. Common use cases are pub/sub scenarios and building scalable distributed applications. They offer smaller plans on shared cluster and production grade dedicated servers starting from $99/month.
More on CloudAMQP…from the CloudAMQP folks**
The log data exposed by CloudAMQP contains the following useful information for CloudAMQP users:
- Metrics: CloudAMQP periodically samples the number of connections, the number of channels and the number of messages (that have been published, confirmed, acknowledged and delivered) and logs this information
- Important Events: - Event Code 410: Account blocked due to max transfer limit exceeded.
- Event Code 210: Account unblocked, transfer limit ok
- Event Code 420: Account blocked due to connection limit exceeded
- Event Code 220: Account unblocked, connection limit ok
- Event Code 431: Connection disconnected due to channels limit exceeded
- Event Code 432: Connection disconnected due to consumser limit exceeded
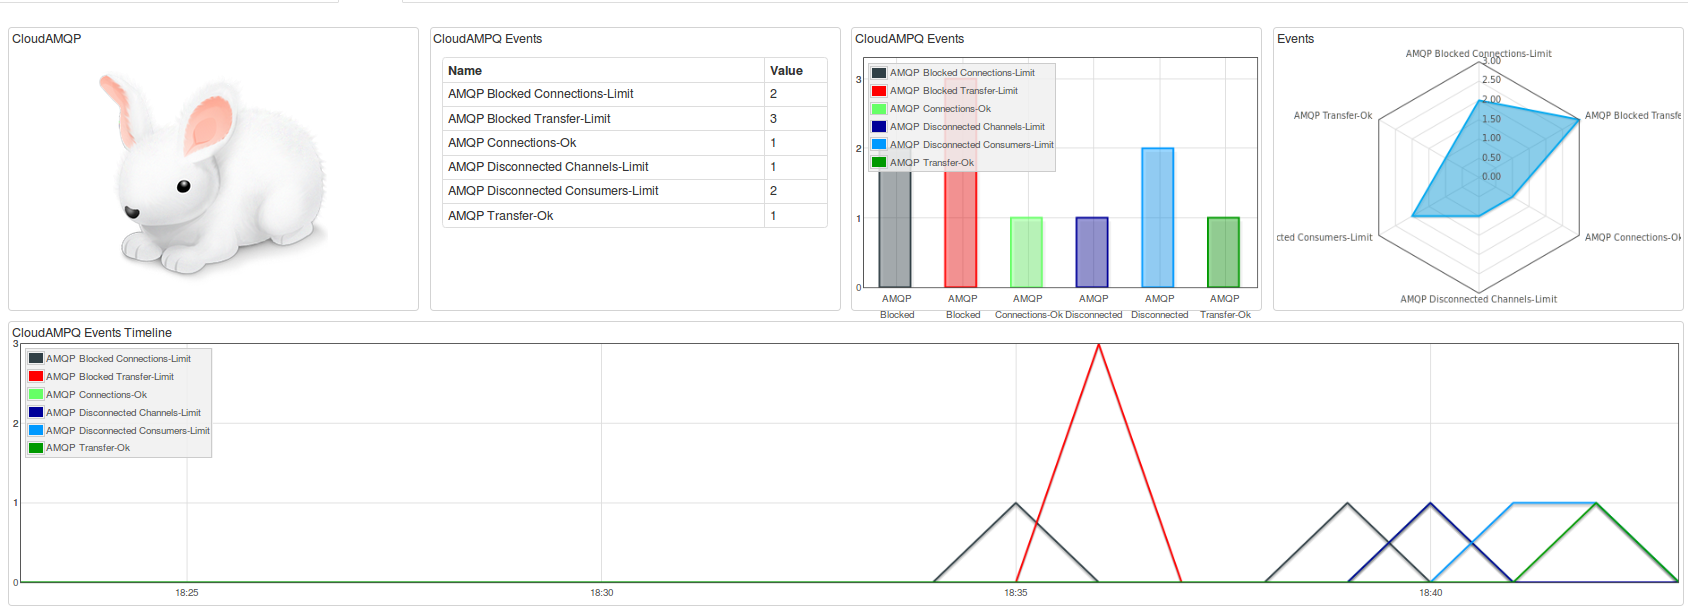
The Logentries add-on tags all the above event codes so that they can be easily identified among the rest of your log data if you want to investigate and react to any CloudAMQP issues. They are also visualized in our dashboard summary view as shown below.

You may also want to be notified when certain CloudAMQP metrics exceed specific thresholds by setting alerts and using our field level extraction while doing so. (Author’s note: I chatted with Carl Horberg, founder of CloudAMQP, about this and he suggests setting alerts so that you are notified ahead of any hard limits kicking in so that you can take action before CloudAMQP will stop accepting any new connections. This only applies for accounts on shared clusters. Users on dedicated servers will never be blocked.)
All you CloudAMQP users out there – let us know if there is anything else you’d like to have highlighted – we’d be happy to add it.)
