Is your team focused on preventing outages and minimizing downtime in production?
Time to resolution is one of the most important operational KPIs for Ops teams, because any time that your application is down, is too long for your users. Whether it’s minutes, hours, or (in a worst case-scenario) days, any time that your systems are down, your business is losing money; and more importantly, customer trust and satisfaction. This creates additional pressure on your team and hurts employee morale. By having a centralized log management tool in your tool belt, you can monitor production issues more efficiently.
Here are 4 ways that a log management tool can easily help you centralize and improve your production-monitoring environment:
1. Real time alerting:
When all of your log records are in a single location, your log management tool can look across your records and alert on specific patterns or errors in your logs. If your log management platform has integrations, you should set-up automatic alerts using tools like PagerDuty, HipChat, Campfire, or use web hooks. The sooner you’re able to understand the nature and environment of the alert, the faster your team can focus on fixing the problem before your clients and prospects experience it.
2. Negative alerting:
What’s just as important as being alerted when a specific pattern occurs? Being alerted when a certain pattern doesn’t occur in your log files. This is where negative alerts can be extremely beneficial. When you’re notified that a certain event isn’t detected, you can get ahead of glitches in the system that can affect the user experience.
3. Anomaly detection:
Patterns are a critical component of log management. You want to be alerted by your log management software when it discovers error-filled patterns, and you want to be alerted when you’re missing patterns.
You’ll also want to be notified if a sudden increase or decrease occurs in your performance metrics. Surges are a sign that something is off in your environment and needs to be investigated. Having all of your logs in one place, makes sure that your log management platform is able find these patterns before your users do.
4. Shareable dashboards:
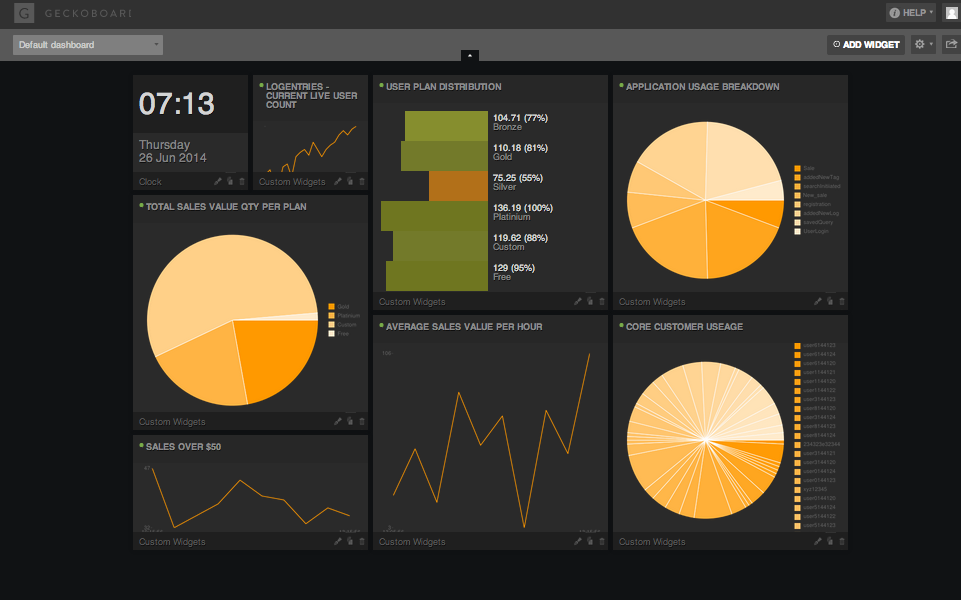
Once you have all of your log data centralized in one place, it’s easy to set-up some shareable dashboards to monitor performance over time. Shareable Dashboards allow for saved searches and analytics visualizations to also be shared via JSON or plugged into an existing centralized monitoring service such as Geckoboard.

