
Any other year, we would already be weeks into Major League baseball season. Of course, the 2020 MLB baseball season has not begun, and whether there will be a season at all is still under discussion. Much more critical work must be done to curb the COVID-19 global pandemic and save lives, and thus it feels a bit silly to even discuss sports—or for that matter, sports metrics. However, while we stay home managing our new routines, and doing what we can to care for our families, friends, and neighbors, perhaps it may also be helpful to let our minds wander, and take this time to explore new ways of thinking. Hopefully this blog helps to provide some useful distraction.
If you are not familiar with the book, movie, or term “Moneyball,” let me explain. The concept of “Moneyball” refers to the initial phase of what many call the “statistics revolution” in baseball (and increasingly all major sports—even hockey!). Baseball is a highly documented game, and nearly everything that happens on the field is recorded. (The admittedly glacial pace of the game allows for this.) For over a century, baseball coaches, scouts, and players evaluated player performance on the basis of narrow, poorly designed, subjective, and yet universally accepted metrics. These metrics were often based on “observable” outcomes, usually highly visible or noteworthy events in the game, which in many cases were driven largely by chance. These statistics had some correlation to future performance, and seemed reasonable, which is why they continued to be used. However, because they were subjective and contained a lot of random noise, they also created massive, exploitable inefficiencies in how the game was played and managed.
In the early 2000s, new metrics focusing on the objective true outcomes of player actions, free of chance, began a revolution that allowed early-adopting teams to gain a significant edge on better-funded competitors. More recently, baseball has exploded again with real-time tracking data, driving new offensive and defensive strategies, and changing the game at a rate never seen before. It all began with a few teams willing to drop the old, accepted metrics and measures, and focus on what really mattered, versus what only appeared to matter.
At this point you may be wondering, “Cool, but what does this have to do with cybersecurity?” I would argue that there are significant parallels with pre-Moneyball baseball and our current cybersecurity industry. We lack useful, universal metrics and instead use narrow, customized metrics, usually based on perceptions, anecdotes, and market research reports. This method of evaluation is likely rife with massive, exploitable inefficiencies. Many teams in our industry are drowning in data but lack a truly universal, meaningful, and useful scorecard. Cybersecurity is a competitive landscape ready for a statistics revolution.
Defining the Game
While sports analogies can be helpful (and hackneyed), it is hard to define cybersecurity as one game; it is more like several different games, often played with different rules. So, we will focus on only one area for now: the Security Operation Center, or SOC. More specifically, a SOC that ingests alerts and outputs incident reports.
Operating a SOC relies on the effective combination of technology, data, and people. Often we discuss these things in isolation, but the reality is that unless the technology works with the data, and the technology and data processes provide actionable outputs for analysts, the SOC will not operate efficiently. However, many cyber-evaluation discussions seem to miss the importance of these connections. “How fast is tool X?” “What is the coverage of signature Y?” “This product uses ML, but this one does not”. Maybe these things matter, but they are missing the point.
Analyzing SOC detection in this piecewise way misses the critical handoffs between elements. We must not only measure threat coverage, but the efficiency of the signatures that provide that coverage. We must account not simply for true positive rates, but also how quickly True Positives enable actual remediation actions, if necessary. The “true outcome” of any alert should be seen as the resulting actions taken (or not taken) by the organization.
Detection signatures are intended to convert data into recommended actions. They should be measured by the efficiency and effectiveness of that conversion. What follows is the development of that metric. A note: Like many of the new-age stats in professional sports, this metric is meant to inform SOC leaders, versus a roll-up metric to display to executives. My hope is that this approach helps analysts and managers optimize their operations.
Detection Efficacy
Signatures, Yara rules, IoCs, and other detection rules are all, at their core, logical filters on data. They are written with the following goal in mind: Reduce a large data set to a smaller dataset, increasing the probability of finding the target. Put another way, they are meant to optimize the density of threats within a dataset. There is, of course, a spectrum of detection, ranging from highly tailored and specific signatures, to broad filters intended to generate weaker signals. There are many other versions of this (often portrayed as a filter or pyramid) in the cybersecurity industry. SpecterOps published a great blog on this very subject and goes further in depth into the roles and responsibilities of various members of a security program. FireEye has referred to this continuum as the ‘Detectrum’ in conference presentations and public discussions. All of these graphics are centered around the concept of detection as essentially a data reduction measure.
Single, static logical signatures usually have to play a tradeoff between false positives and false negatives. On one hand, high-fidelity detection methods may fire very rarely, miss slightly different variants of the target, or quickly decay in effectiveness. Conversely, low-fidelity detections, such as those using heuristics or methodology rules to cast a wider net, can result in mountains of "suspicious" data, which is still too much data for a human to reasonably analyze without further filtering. A SOC can potentially improve this zero-sum game by incorporating multiple signals from multiple stages of detection. This is typically the case in most SOC environments—a variety of detections, including endpoint, network, and log sources. The trick is how to properly categorize, prioritize, and manage these detections. In order to do that, you must be able to compare them using an objective metric. Enter Detection Efficacy.
Instead of measuring a signature simply via True Positive or False Positive rates, we must make an effort to measure the effectiveness of a signature in terms of evil found and reported, weighed against the effort required to do so.
We begin with a short set of assumptions:
- A SOC alert flow consists of detection filters applied to technology, the results of which are passed for analyst validation.
- These alerts contain some information that the analyst uses to make a decision.
- The SOC has a finite, measurable human and machine capacity.
- The primary goal of a SOC analyst is to find, report, and stop malicious activity on the network.
- The SOC maintains statistics on false positives and true positives for the alerts presented to analysts.
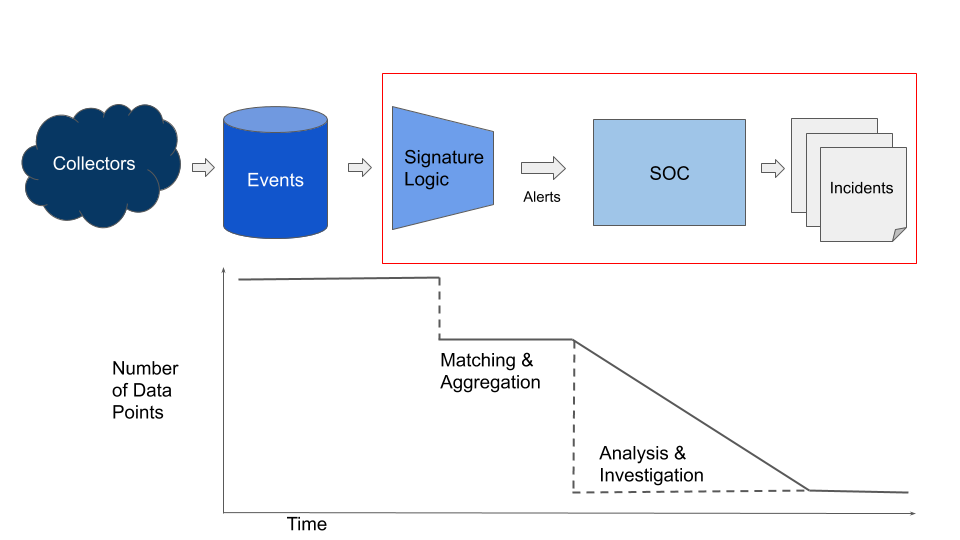
Below in Figure 1 we show a simplified version of this process, as events become alerts, and alerts become incidents. The steps we will discuss are noted by the red box - the efficacy of the exchange between the signature logic and the SOC.
We seek to derive a useful, universal metric to evaluate detection signatures. For this article, we will call this metric “Detection Efficacy.” We assume that every alert has both an expected benefit (finding evil) and an expected cost (the time and resources it takes to review). The worth of the signature should therefore weigh the costs versus the benefits. We’ll start by calculating the expected benefit.
Expected Benefit
Here is a quick primer on expected values:
If I bet $50 on a horse with a 20% chance of winning a race, the expected value of the bet is $50 times 20% = $10. Applying this logic to security looks like the following: If a detection signature has a historical 30% true positive rate and produces an average of 400 alerts per month, the expected number of true positive alerts for the next month is 400 times 30% = 120 true positive alerts. Therefore, expected average true positives for a signature is equal to:
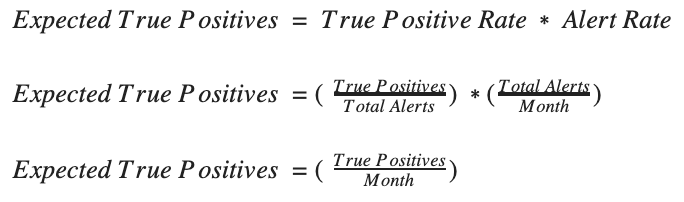
(Note: we use “month” as our time period for these calculations, but this time window can be changed, as long as the same time window is used for all calculations.)
Expected true positives represents the benefit of a signature—the thing we wish to get out of it. But if we are calculating efficiency, we must also account for the cost. The main cost is (usually) analyst time. In order to find the true positives in a sea of alerts (and mark the remainder as FP), analysts have to comb through all of the hits. That work takes skilled analysts and time, which costs money.
Expected Cost
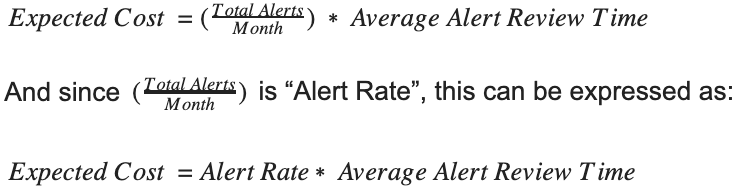
Calculating the cost is straightforward—the total number of analyst-hours the signature generates. This is calculated by multiplying the total number of expected alerts, times the average review time per alert. If it takes 15 minutes on average to review an alert and make a decision, then the time cost of this service over a month is:
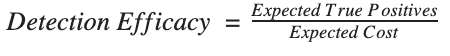
So, now we have expected value and expected cost. We can combine these by dividing cost into value to determine the efficacy of the signature.
When we divide expected cost into expected benefit:
And substitute in for the terms:
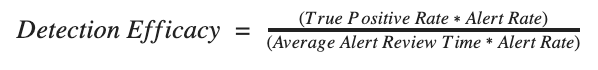
The beauty here is that Alert Rate cancels out, thus making the evaluation of each signature agnostic to their relative alert totals. This means that with this metric, you can evaluate “noisy” signatures on the same basis as “quiet” ones.
We thus arrive with a simple metric of:
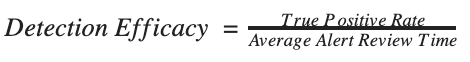
This final calculation can therefore provide a solid, volume-agnostic way to evaluate all signatures and services, regardless of how noisy they are.
Using this Metric
When evaluating the capacity and efficiency of a SOC, hard decisions often need to be made about how to optimize. Anyone responsible for deciding which signatures to include, which to prioritize, and which to discard, has likely been presented with metrics like True Positive Rate or Analyst Review Time. The relatively simple combination shown above should help SOC decision makers to justify signature prioritization decisions across a variety of signature types.
Several years ago, I was charged with managing our endpoint detection services for a large managed defense provider. We had limited bandwidth, a wide variety of customers, and a large signature library, covering threats ranging from commodity malware, to methodology-based things like lateral movement, to rarely seen but highly important APT backdoors. These signatures had been vetted and examined for quality. They had proven value and valid reasons for existing in our library. However, with our given capacity, we simply could not evaluate alerts from all of them. Looking at True Positive rates, False Negative rates, severity ratings, and ‘customer impact’ estimations just led me in circles. I needed something objective to compare these signatures, and after many discussions with colleagues, customers, and my leadership, developed the metric described above. This allowed me to explain to my leadership and to clients, in terms of value, why we prioritized review of some signatures versus others. When facing a perpetually rising tide of alerts, deciding what you won’t do is absolutely critical to maintaining a sustainable service. That’s easier said than done, and in those discussions, it definitely helps to have some numbers to back you up.
It should be noted that important considerations such as severity, impact, proper alert labeling, vulnerability profiles, and others, are not included in this metric. Additionally, SOCs should always be striving to reduce analyst review time through the use of automation, playbooks, and machine learning. Alas, those subjects will have to wait for another blog post.
Our hope with the above walkthrough is to move toward more universal, outcome-based metrics in our industry. Metrics should not exist simply for SOC dashboards and yearly reports—they should actively drive improvements and decisions in security programs. After over a century of doing things the same way, the Major League baseball teams that are willing to challenge convention have gotten ahead of the competition. Surely, in our nascent industry, there is even more room for improvement.
