Top 5 multi group queries for analyzing network sensor data
We launched the Insight Network Sensor earlier this year and have since seen great adoption from both new and existing customers. The main use case behind this success is the need for network visibility. Customers want to know what is happening on their networks, root out any security issues, and keep their networks running efficiently.
When discussing the Insight Network Sensor with customers, one common request was doing a tighter integration of network data with InsightIDR. Customers see the power of network data when combined with agent and log data, and they want even more ways to visualize the data and generate alerts if suspicious activity is detected. Right now, we are working on a number of projects to help customers get more from their Insight Network Sensors.
One recent update within log search called “LEQL Multi-groupby” opens up a range of new ways to visualize network data. This feature allows customers to group by multiple fields in their log data searches. With LEQL multi-groupby, customers can visualize more data in a log search by grouping up to five fields in one single query, reducing the number of queries they need to run in multiple tabs and making their searches more efficient.
There are many ways this new feature can be used. Here are my top five multi-groupby queries that can be used to visualize network sensor data:
1. Show which apps users are using to export data out of a network and into a network
Data exfiltration continues to be a hot topic among network and security managers. One question I often get asked is, “How can I find out what users are sending data out of the network and what applications they are using?”
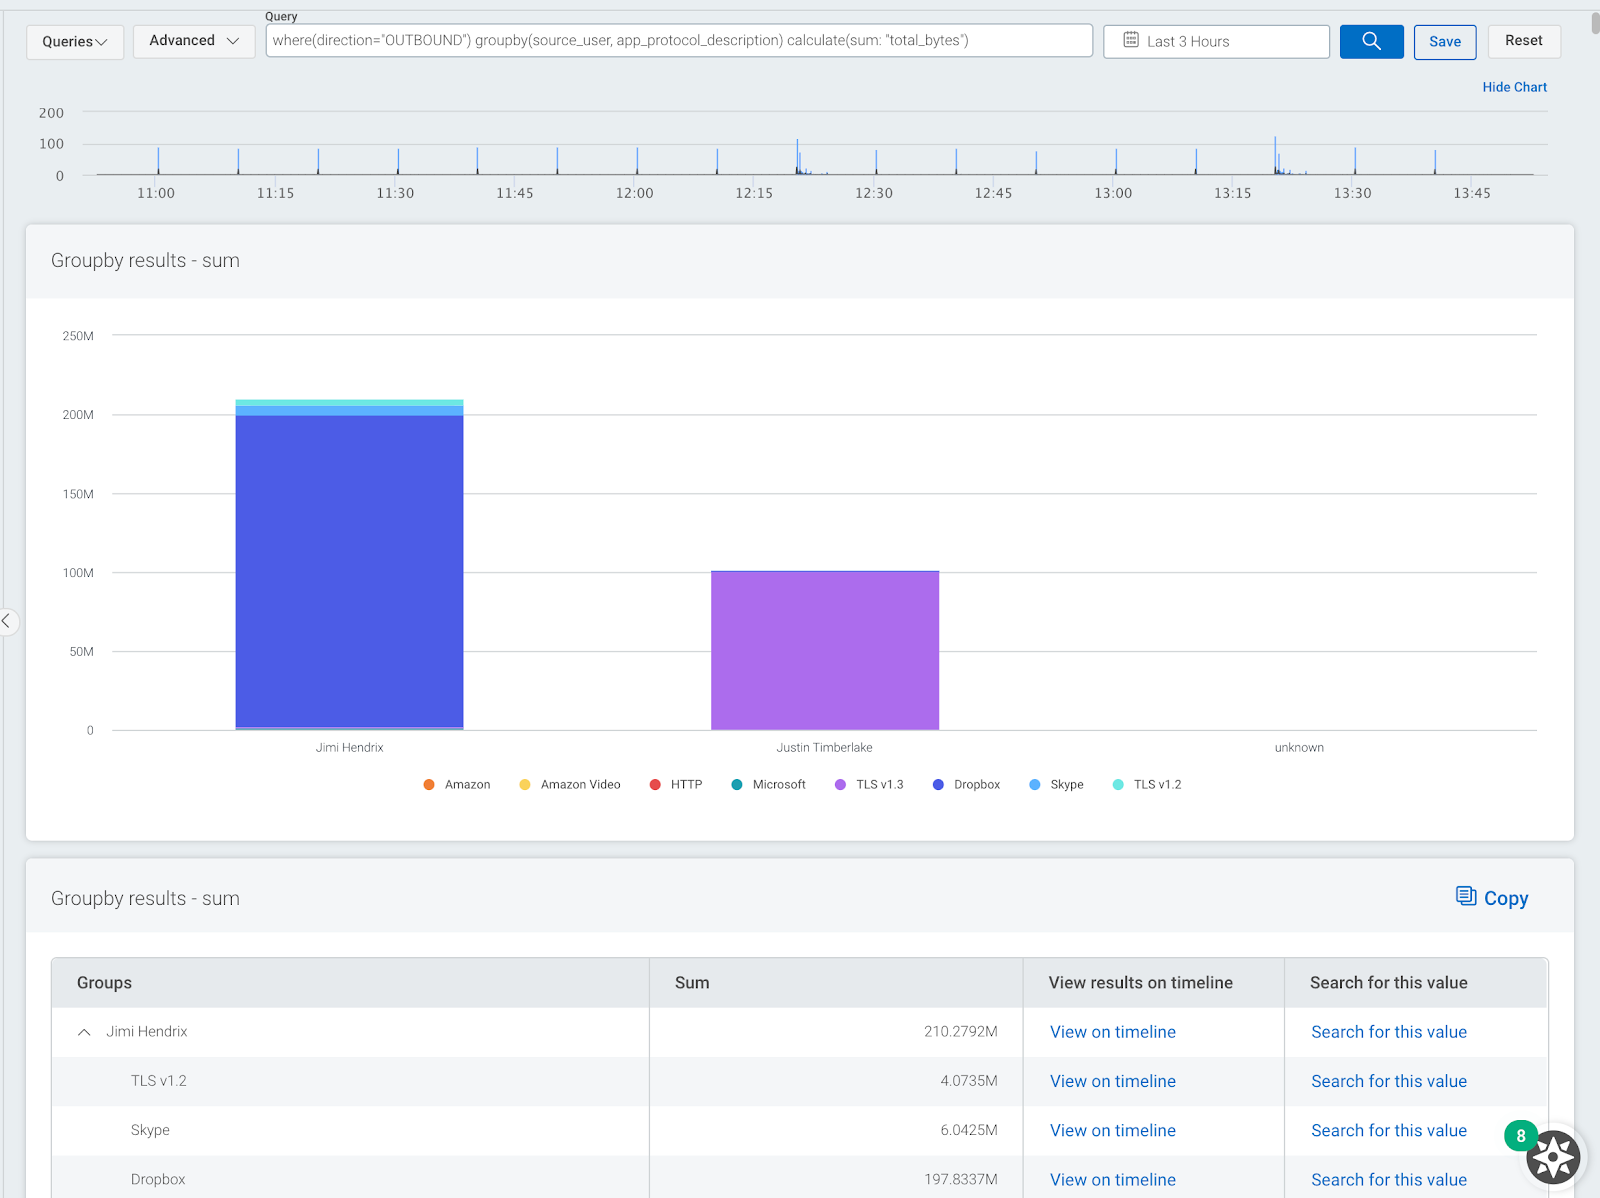
The following query can be used to group all network data by username and then break it down to show what network protocols and applications are being used to export data out of the network. Use the Network Flow logset.
where(direction="OUTBOUND") groupby(source_user, app_protocol_description) calculate(sum: "total_bytes")
The image below shows a sample output. Here, we can see top users and we can see where applications such as Dropbox are being used to transfer data.
You can also use a similar query to do the opposite of this and show what services and applications users are using to download data into a network. Use this query to check your own data.
where(direction="INBOUND") groupby(source_user, app_protocol_description) calculate(sum: "total_bytes")
2. Show what countries and associated apps are connecting to the network
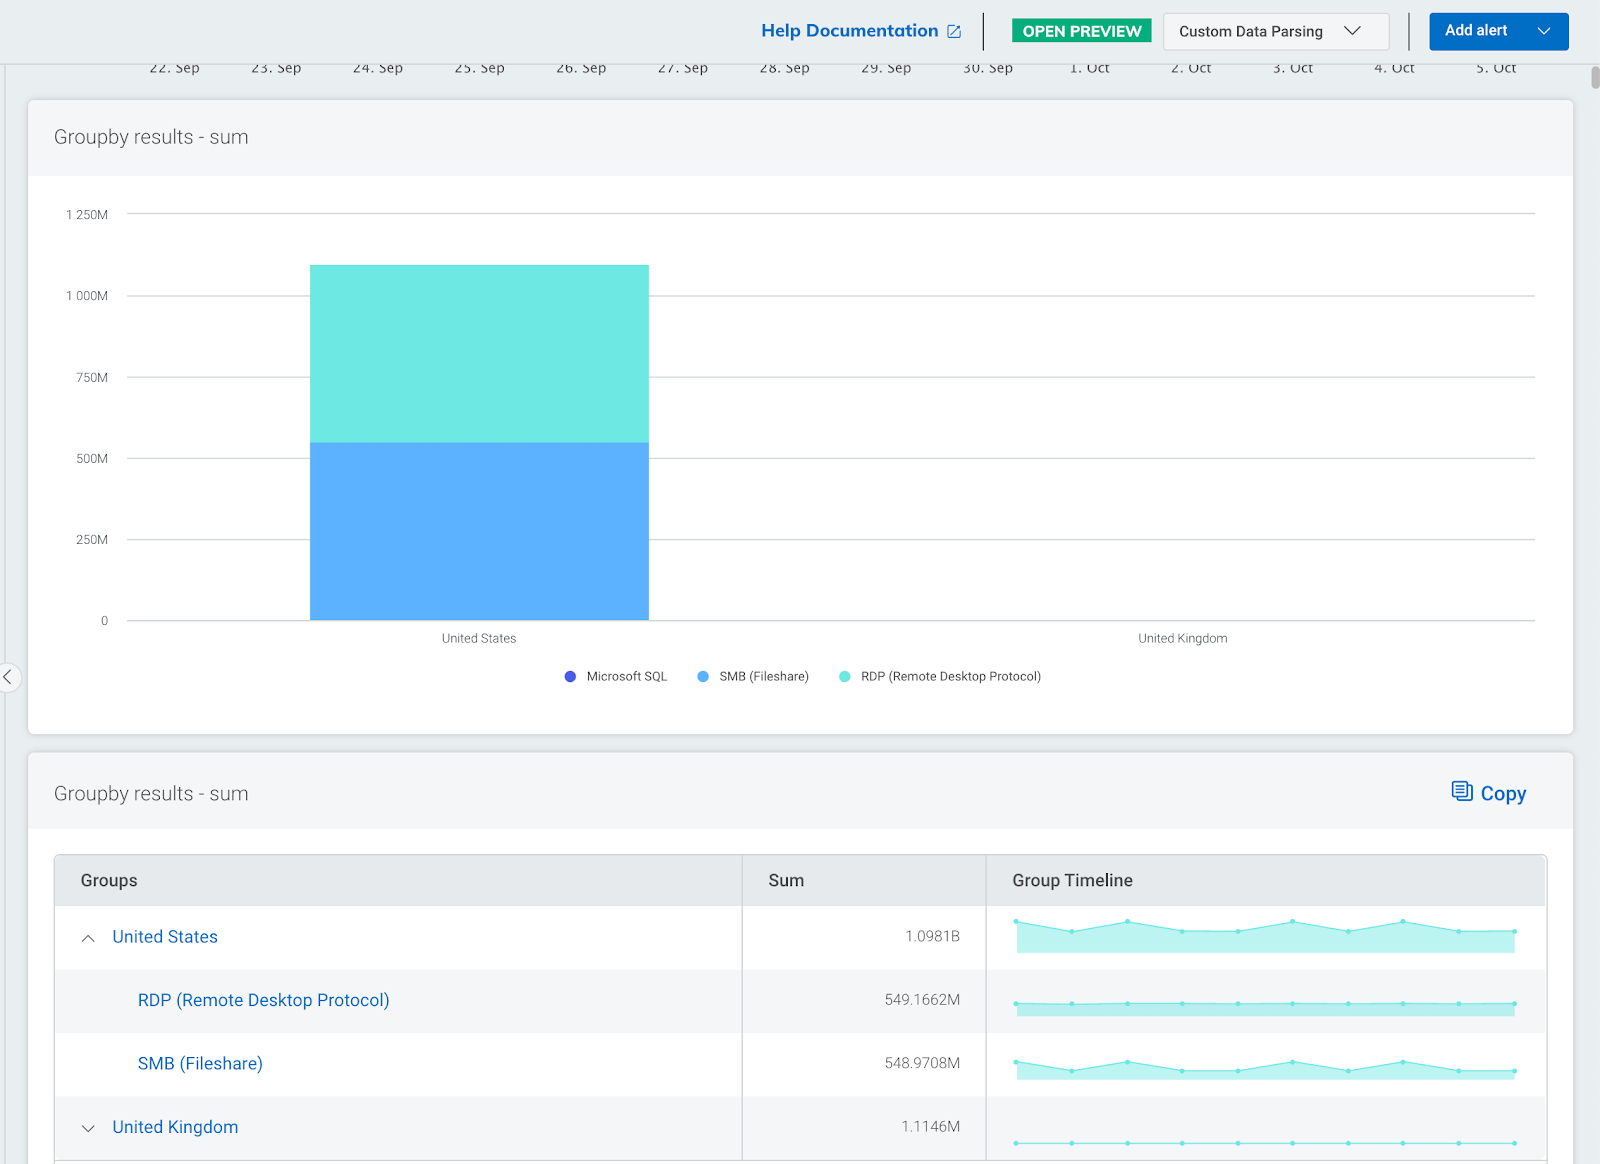
We are finding this query very useful when monitoring users working from home. It allows you to see which locations inbound connections are coming from with a breakdown of what applications are being used. Remote users will typically connect to a network using encrypted protocols over a VPN. I have used this query to root out suspicious inbound traffic such as remote desktop protocol (RDP) or server messaging block (SMB). These protocols are often used as an attack vector by cybercriminals. Use the Network Flow logset.
where(direction="INBOUND") groupby(geoip_country_name, app_protocol_description) calculate(sum: "total_bytes")
The image below shows a sample output. Here we can see the countries with the most inbound connections to our network together with a breakdown of what applications are being used.
3. Show DNS servers and associated DNS lookups
Monitoring DNS activity on a network is a vital part of any network security strategy. You can do this by capturing log files from DNS servers and passively by capturing DNS metadata from network traffic. DNS metadata can be used to check for suspicious activity on a network by cross-referencing domains with known bad domain names. Another use case for DNS metadata is data attribution, where domain names are shown next to IP addresses.
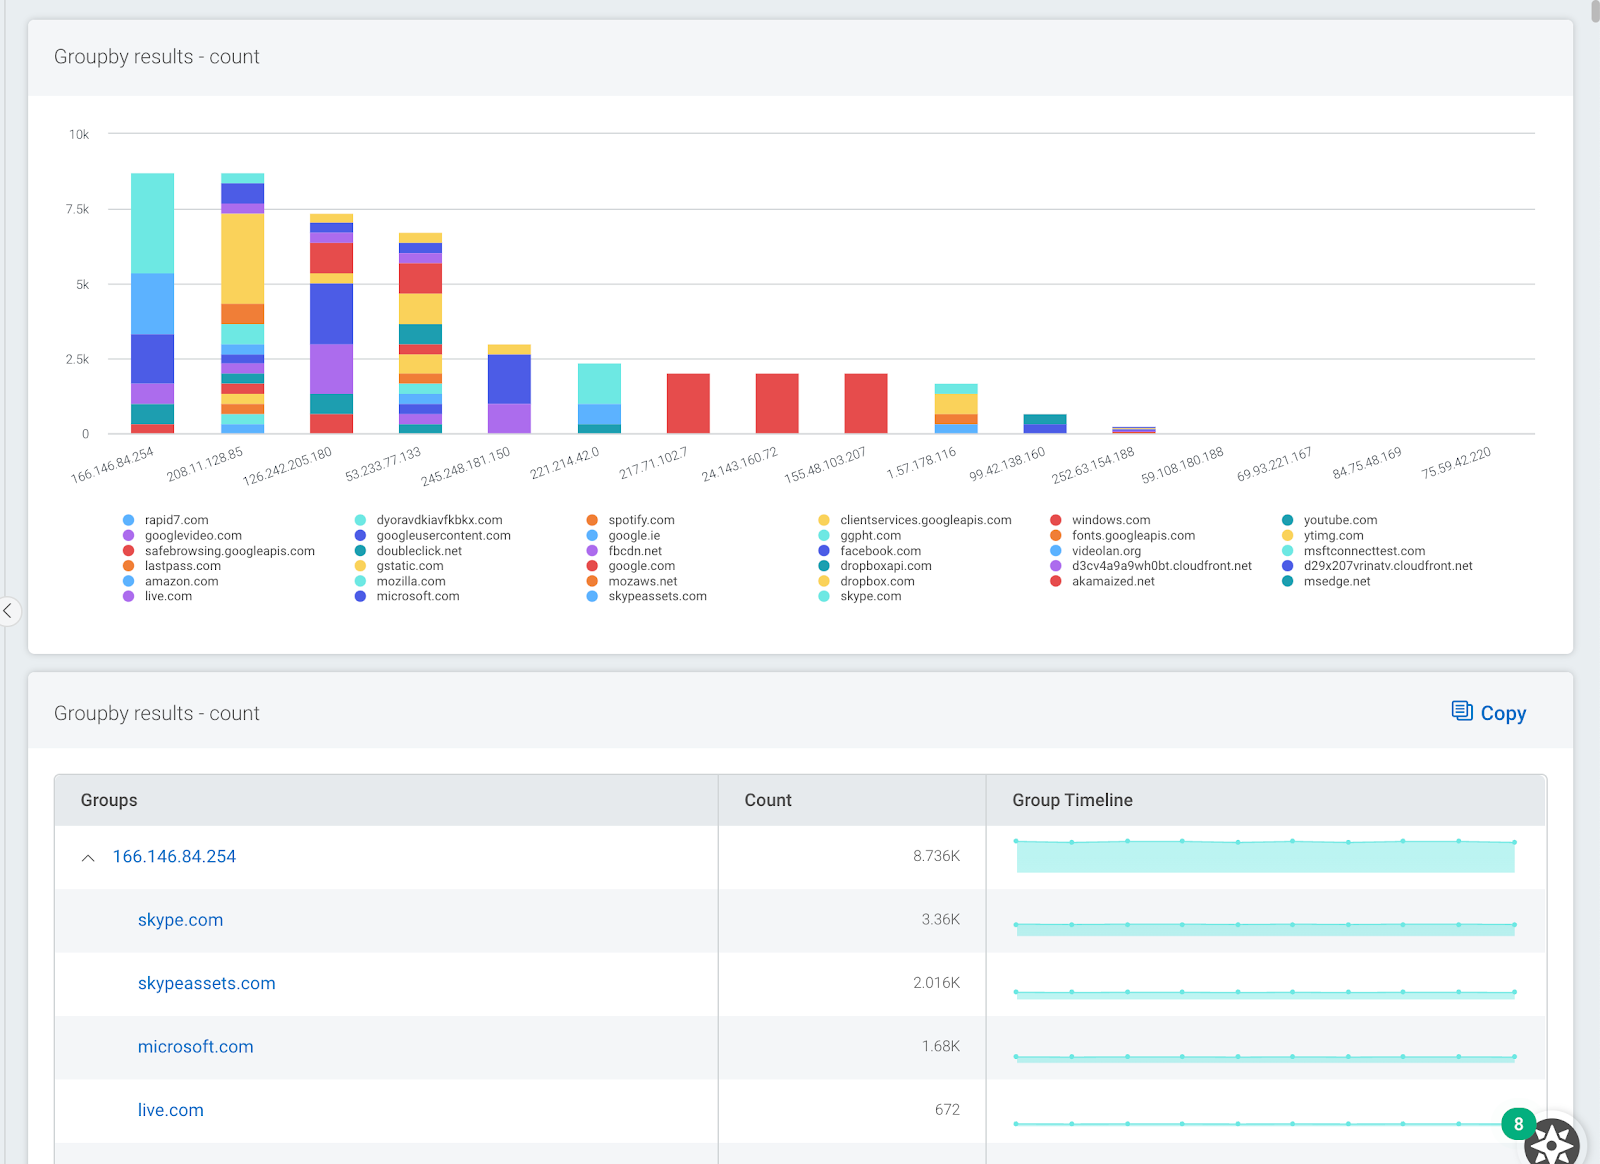
This query allows you to see what DNS servers are in use on your network and gives a breakdown of what domains they are resolving. This can be very useful for identifying any clients on your network that are not using official or corporate DNS servers. Use the DNS Query logset within log search.
groupby(dns_server_address, top_private_domain)\
The image below shows a sample output. Here we can see one DNS server is being used to resolve many Microsoft services. This may be important information if we plan to block access to external DNS servers.
4. Show what systems are triggering IDS events
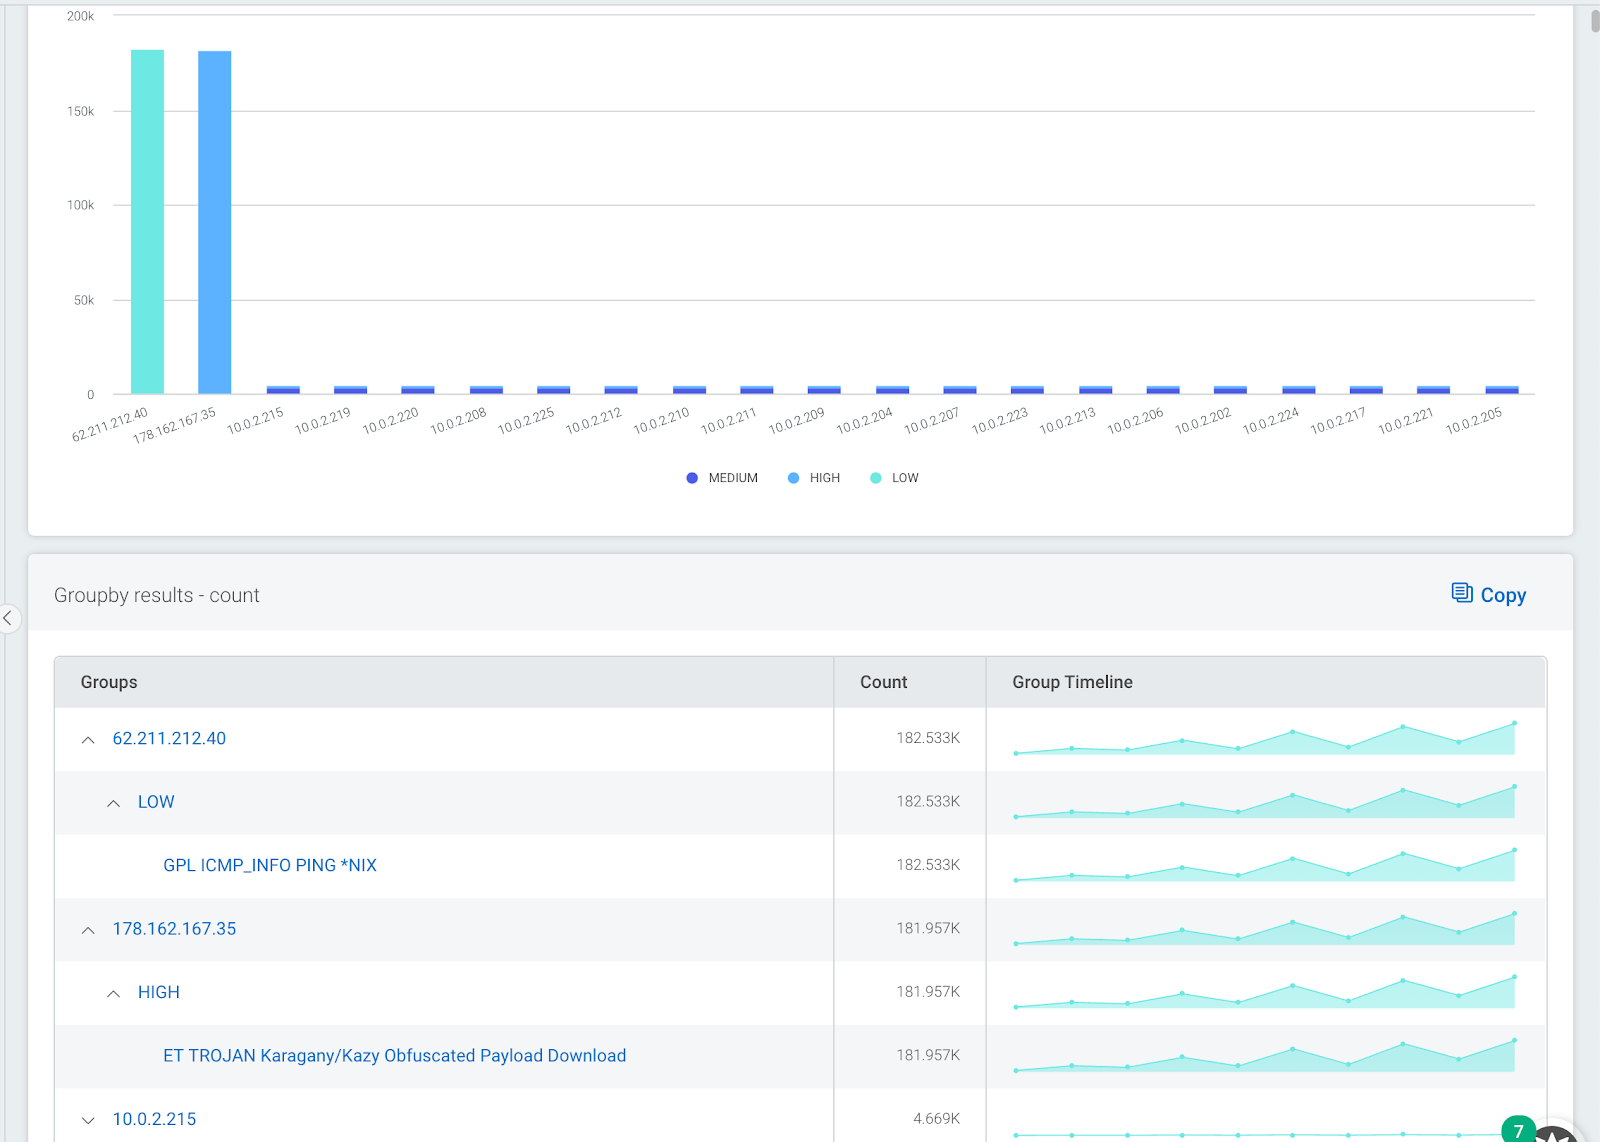
If you have deployed one or more intrusion detection systems on your network, it may be worth checking which assets on your network are triggering the most events. The next query allows you to group together all IDS alerts by IP address with a secondary grouping of what alerts they are triggering. I have often found that a small number of systems on a network can be responsible for a large percentage of IDS events. Fixing or tuning out these alerts can significantly reduce the amount of IDS events overall. Use the IDS Alert logset within log search.
groupby(source_ip, severity, description)
The image below shows a sample output. Here, we can see that two external systems are responsible for a large percentage of all IDS events. Drilling down, we can see that all events are associated with just two IDS signatures.
5. Show top countries and apps that users are connecting to
This type of query has always been useful for tracking what users are connecting to from inside a network. A different variant would be to switch the order of the grouping so that applications are shown at the top level.
The output is also useful if you have users connecting in via VPN. If you have not implemented split tunneling, you may end up with a lot of unwanted network traffic at your VPN gateways. Unwanted traffic may be video streaming or cloud backups, which can cause congestion and eat up valuable bandwidth. Use the Network Flow logset.
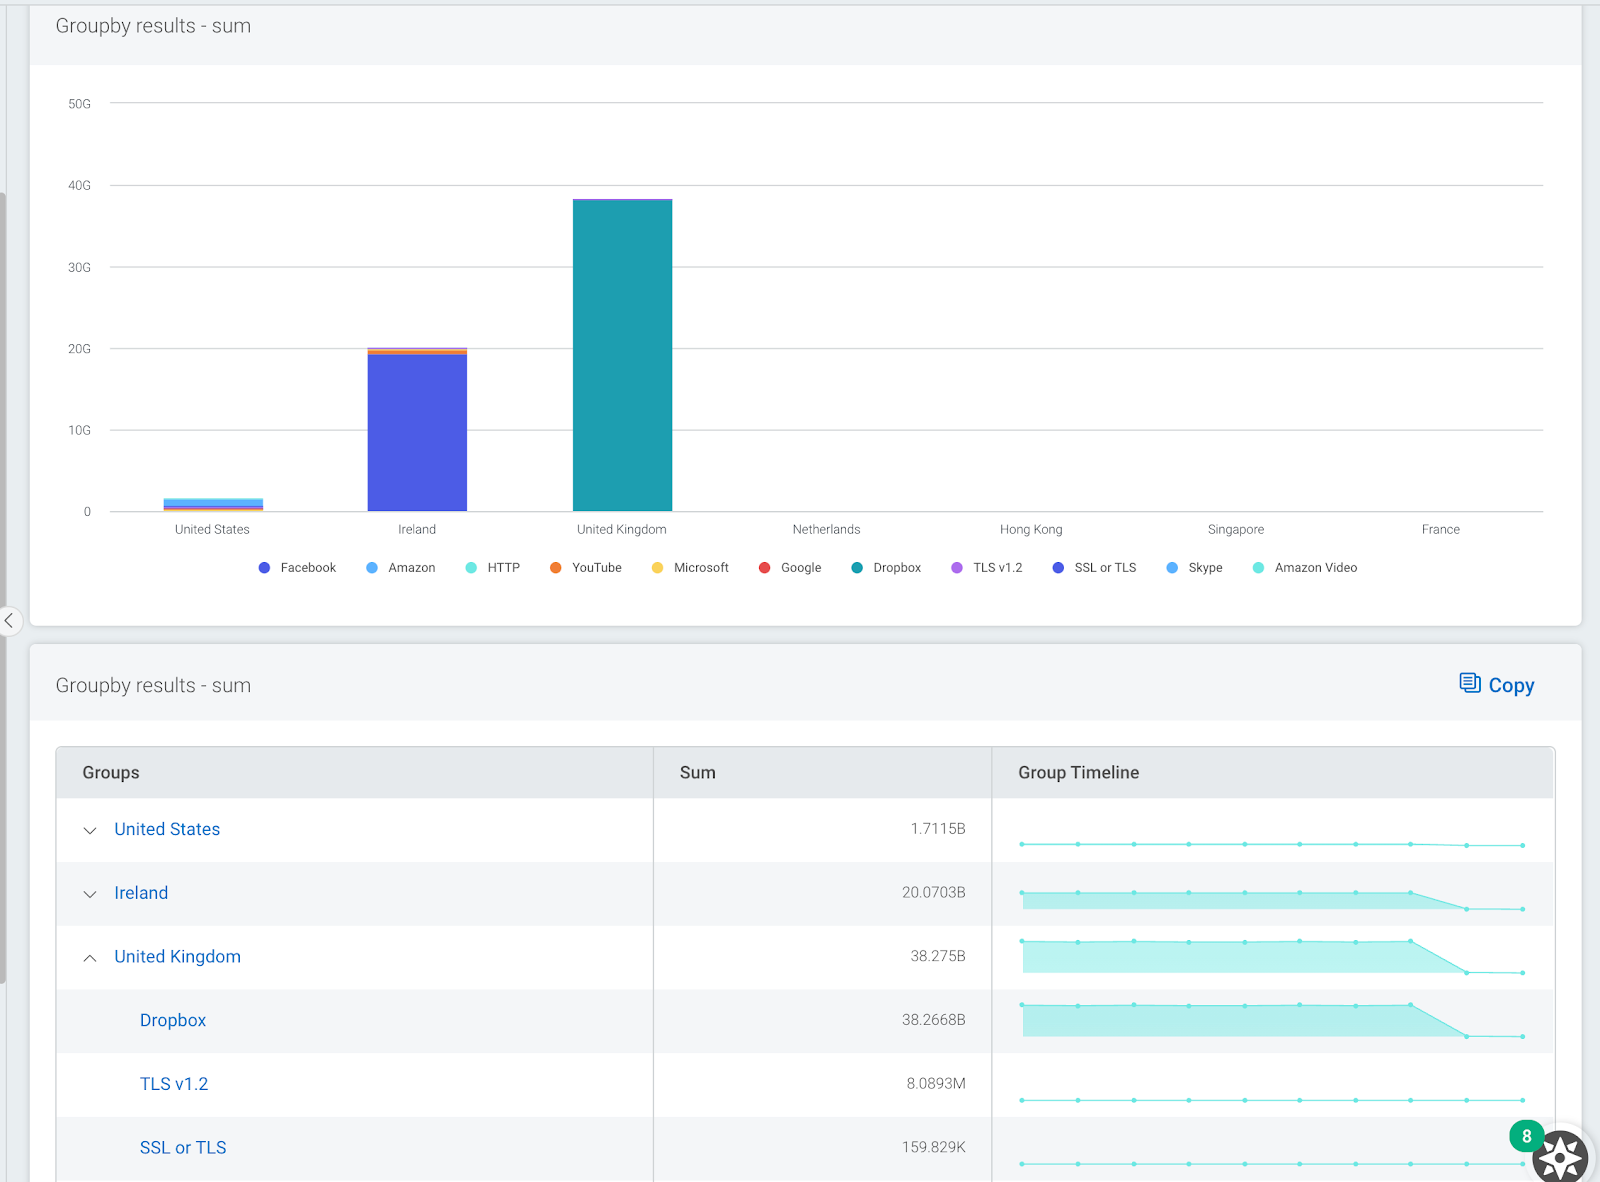
where(direction="OUTBOUND") groupby(geoip_country_name, app_protocol_description) calculate(sum: "total_bytes")
The image below shows a sample output. Here, we can see that most data from my network was sent to IP addresses registered in the U.K., and the main application used was Dropbox.
This is just a small sample of some of the powerful visualizations and analysis that are possible with Network Traffic Data and our latest log search update, LEQL Multi-groupby. Learn more about Multi-groupby in our recent blog post.
NEVER MISS A BLOG
Get the latest stories, expertise, and news about security today.
Subscribe